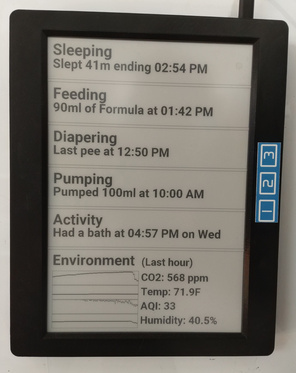
I want to share a tool I’ve been using to help track baby activities, an ESPHome-powered 10" eInk dashboard:
(Snapshot taken after opening up the windows right after a long nap. Click for a full size image.)
This dashboard is an Inkplate10, which is an upcycled Kindle DX display, retrofitted with an ESP32 for easy hackability.
There is a lot going on with this dashboard, let’s review the parts.
Dashboard Components
Baby Data
The baby data is fetched from the local MQTT broker and displayed in a human-friendly format.
The baby data gets into MQTT through a custom bidirectional bridge with the baby tracking app. I may open source this someday, but for now it is private (sorry).
Using the app bridge, I’m able to export the baby data to MQTT for the dashboard, but I’m also able to add data by writing into MQTT (using the rf-bridge ESPHome component) with a remote:
This allows me to read and write baby data without using an app!
Environment Data
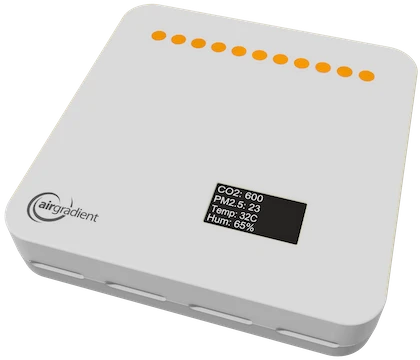
The environmental data for the nursery comes from an AirGradient Pro.
I originally bought this monitor years ago because I was curious about the CO2 levels in my bedroom. Turns out that yes, two adults in a sealed room will generate unhealthy levels (>5000ppm) by morning.
I moved it into the nursery to measure CO2 and other data.
Of course, I also flashed it with ESPHome. It no longer needs the internet, and can publish directly to my local MQTT broker for the baby dashboard (and other tools) to consume.
Environment Graphs
The graphs on the dashboard are all rendered locally using the ESPHome graph component. No additional software or servers are required.
The downside to this approach is that there is no historical data, it is all in memory.
Drawing on eInk
The actual code for drawing the eInk display involves declaring shapes, coordinates, text, fonts, boxes, etc.
It is all a little tedious, but do you know who knows this drawing language very well? ChatGPT.
Incredibly, I simply uploaded a screenshot of the baby tracking app, told ChatGPT the dimensions of my display, and it gave me all the code with all the right coordinates, font sizes, rectangles, etc for me to get going.
Data Flow
One amazing side effect from this architecture is the incredible low latency.
Check out a video of it in action. Here I’m clicking the “poop diaper” button. Watch the “Diapering” section of the dashboard and app update:
Did you miss it? Here it is in slow motion:
Thanks to the eInk’s partial update, the poop is added in the blink of an eye.
Total latency is a little less than 2 seconds from the click to the dashboard update.
You might think that the clicker is somehow talking directly to the dashboard to achieve this speed, but that is not the case.
Here is the sequence diagram:
Since every actor in this timeline is operating on real time events (no polling at any point), everything updates very quickly.
The eInk dashboard isn’t responding to click events. It is responding to new app data updates. The dashboard gets updated regardless of where the data update came from (clicker or another app user).
The end result is that the dashboard can refresh faster than the app can get the same update and redraw. Certainly way faster than you can pull out your phone, open the app, and tap on the screen to add a poopy diaper!
Conclusion
I really enjoy using ESPHome for this sort of thing. Sure, the YAML is huge (see the full spec at the end of the blog post), but it is way shorter than all the C++ code I would have had to write if I was to do it myself.
Plus ESPHome has all the nice features for remote development like over-the-air updates, remote logging, safe mode, etc. You don’t have to be tethered to the device to iterate on it.
ESPHome already had drivers for eInk panels, modules for subscribing to MQTT topics, and ways to construct graphs and draw on displays with fonts, icons, and shapes. It really has everything I needed to make this project a success, with good abstractions, modularity, an efficient developer experience, and a way to break out to raw C++ (lambdas) when necessary.
I’m still on the fence on whether all this baby data is “good”. It feels cool, but is it actually just adding more worry and data entry busywork to already overworked parents? I don’t know.
Special thanks to my friend Sunil for gifting me the Inkplate10 and enabling me to build something really awesome with it!
Reference: Full ESPHome YAML
esphome:
  name: inkplate
  platform: ESP32
  board: esp-wrover-kit

wifi:
  ssid: !secret wifi_ssid
  password: !secret wifi_password

ota:
- platform: esphome
  password: !secret ota_password

mqtt:
  broker: !secret mqtt_broker
  log_topic: null

web_server:
  !include web_server_common.yaml

logger:

i2c:

text_sensor:
  - platform: mqtt_subscribe
    name: "Sleep Data"
    id: sleep_data
    topic: "mqtt2huckleberry/lastSleep"
    on_value:
      then:
        - component.update: inkplate_display

  - platform: mqtt_subscribe
    name: "SweetSpot Data"
    id: sweetspot_data
    topic: "mqtt2huckleberry/lastSweetSpot"
    on_value:
      then:
        - component.update: inkplate_display

  - platform: mqtt_subscribe
    name: "Feeding Data"
    id: feeding_data
    topic: "mqtt2huckleberry/lastFeed"
    on_value:
      then:
        - component.update: inkplate_display

  - platform: mqtt_subscribe
    name: "Diaper Data"
    id: diaper_data
    topic: "mqtt2huckleberry/lastDiaper"
    on_value:
      then:
        - component.update: inkplate_display

  - platform: mqtt_subscribe
    name: "Pumping Data"
    id: pumping_data
    topic: "mqtt2huckleberry/lastPump"
    on_value:
      then:
        - component.update: inkplate_display

  - platform: mqtt_subscribe
    name: "Activity Data"
    id: activity_data
    topic: "mqtt2huckleberry/lastActivity"
    on_value:
      then:
        - component.update: inkplate_display

  - platform: mqtt_subscribe
    name: "CO2 PPM"
    id: co2_ppm
    topic: "airgradient-pro/sensor/airgradient_pro_senseair_co2_value/state"

  - platform: mqtt_subscribe
    name: "Temp F"
    id: temp_f
    topic: "airgradient-pro/sensor/airgradient_pro_temperature_f/state"

  - platform: mqtt_subscribe
    name: "AQI"
    id: aqi
    topic: "airgradient-pro/sensor/pm_2_5_aqi/state"

  - platform: mqtt_subscribe
    name: "Humidity"
    id: humidity
    topic: "airgradient-pro/sensor/airgradient_pro_humidity/state"

sensor:
  - platform: template
    id: co2_ppm_numeric
    name: "CO2 PPM Numeric"
    update_interval: 10s
    lambda: |-
      if (id(co2_ppm).has_state()) {
        return atof(id(co2_ppm).state.c_str());
      } else {
        return 0;
      }
    on_value:
      then:
        - component.update: inkplate_display

  - platform: template
    id: temp_f_numeric
    name: "Temperature Numeric"
    update_interval: 10s
    lambda: |-
      if (id(temp_f).has_state()) {
        return atof(id(temp_f).state.c_str());
      } else {
        return 0;
      }
  - platform: template
    id: aqi_numeric
    name: "AQI Numeric"
    update_interval: 10s
    lambda: |-
      if (id(aqi).has_state()) {
        return atof(id(aqi).state.c_str());
      } else {
        return 0;
      }
  - platform: template
    id: humidity_numeric
    name: "Humidity Numeric"
    update_interval: 10s
    lambda: |-
      if (id(humidity).has_state()) {
        return atof(id(humidity).state.c_str());
      } else {
        return 0;
      }

graph:
  - id: co2_graph
    duration: 1h
    width: 360
    height: 60
    min_value: 400
    max_value: 1000
    y_grid: 100
    traces:
      - sensor: co2_ppm_numeric
        continuous: true
        line_type: SOLID
        color: black

  - id: temp_graph
    duration: 1h
    width: 360
    height: 60
    y_grid: 10
    min_value: 50
    max_value: 110
    traces:
      - sensor: temp_f_numeric
        line_type: SOLID
        continuous: true
        color: black

  - id: aqi_graph
    duration: 1h
    width: 360
    height: 60
    y_grid: 10
    min_value: 0
    max_value: 60
    traces:
      - sensor: aqi_numeric
        line_type: SOLID
        color: black
        continuous: true

  - id: humidity_graph
    duration: 1h
    width: 360
    height: 60
    y_grid: 10
    min_value: 20
    max_value: 80
    traces:
      - sensor: humidity_numeric
        line_type: SOLID
        color: black
        continuous: true

color:
  - id: black
    red: 0%
    green: 0%
    blue: 0%

mcp23017:
  - id: mcp23017_hub
    address: 0x20

display:
- platform: inkplate6
  id: inkplate_display
  greyscale: false
  partial_updating: true
  update_interval: 60000s
  model: inkplate_10

  ckv_pin: 32
  sph_pin: 33
  gmod_pin:
    mcp23xxx: mcp23017_hub
    number: 1
  gpio0_enable_pin:
    mcp23xxx: mcp23017_hub
    number: 8
  oe_pin:
    mcp23xxx: mcp23017_hub
    number: 0
  spv_pin:
    mcp23xxx: mcp23017_hub
    number: 2
  powerup_pin:
    mcp23xxx: mcp23017_hub
    number: 4
  wakeup_pin:
    mcp23xxx: mcp23017_hub
    number: 3
  vcom_pin:
    mcp23xxx: mcp23017_hub
    number: 5

  rotation: 90
  lambda: |-
      // Set background to white
      it.fill(COLOR_ON);

      // Section: Sleep
      it.rectangle(0, 0, 825, 160, COLOR_OFF);
      it.print(20, 10, id(font_xlarge), COLOR_OFF, "Sleeping");
      it.print(20, 70, id(font_large), COLOR_OFF, id(sleep_data).state.c_str());

      // Section: Feeding
      it.rectangle(0, 170, 825, 160, COLOR_OFF);
      it.print(20, 180, id(font_xlarge), COLOR_OFF, "Feeding");
      it.print(20, 240, id(font_large), COLOR_OFF, id(feeding_data).state.c_str());

      // Section: Diaper
      it.rectangle(0, 340, 825, 160, COLOR_OFF);
      it.print(20, 350, id(font_xlarge), COLOR_OFF, "Diapering");
      it.print(20, 410, id(font_large), COLOR_OFF, id(diaper_data).state.c_str());

      // Section: Pumping
      it.rectangle(0, 510, 825, 160, COLOR_OFF);
      it.print(20, 520, id(font_xlarge), COLOR_OFF, "Pumping");
      it.print(20, 580, id(font_large), COLOR_OFF, id(pumping_data).state.c_str());

      // Section: Activity
      it.rectangle(0, 680, 825, 160, COLOR_OFF);
      it.print(20, 690, id(font_xlarge), COLOR_OFF, "Activity");
      it.print(20, 750, id(font_large), COLOR_OFF, id(activity_data).state.c_str());

      // Section: Environment
      it.rectangle(0, 850, 825, 350, COLOR_OFF);
      it.print(20, 860, id(font_xlarge), COLOR_OFF, "Environment");
      it.print(390, 875, id(font_medium), COLOR_OFF, "(Last hour)");

      it.graph(20, 940, id(co2_graph));
      it.rectangle(20, 940, 360, 60, COLOR_OFF);
      it.printf(390, 940, id(font_medium), COLOR_OFF, "CO2: %.0f ppm", id(co2_ppm_numeric).state);

      it.graph(20, 1001, id(temp_graph));
      it.rectangle(20, 1001, 360, 60, COLOR_OFF);
      it.printf(390, 1001, id(font_medium), COLOR_OFF, "Temp: %.1fF", id(temp_f_numeric).state);

      it.graph(20, 1062, id(aqi_graph));
      it.rectangle(20, 1062, 360, 60, COLOR_OFF);
      it.printf(390, 1062, id(font_medium), COLOR_OFF, "AQI: %.0f", id(aqi_numeric).state);

      it.graph(20, 1123, id(humidity_graph));
      it.rectangle(20, 1123, 360, 60, COLOR_OFF);
      it.printf(390, 1123, id(font_medium), COLOR_OFF, "Humidity: %.1f%%", id(humidity_numeric).state);


font:
  - file: "fonts/Roboto-Regular.ttf"
    id: font_small
    size: 30

  - file: "fonts/Roboto-Bold.ttf"
    id: font_medium
    size: 45

  - file: "fonts/Roboto-Bold.ttf"
    id: font_large
    size: 50

  - file: "fonts/Roboto-Bold.ttf"
    id: font_xlarge
    size: 60
Comment via email

