An Eink Daily Solar Output Display
I really love E Ink (or epaper, eInk, etc) dashboards.
I love the low power, the contrast, and just the future yet low-tech look.
This post is on another dashboard I made to show the solar production of the array in my home.
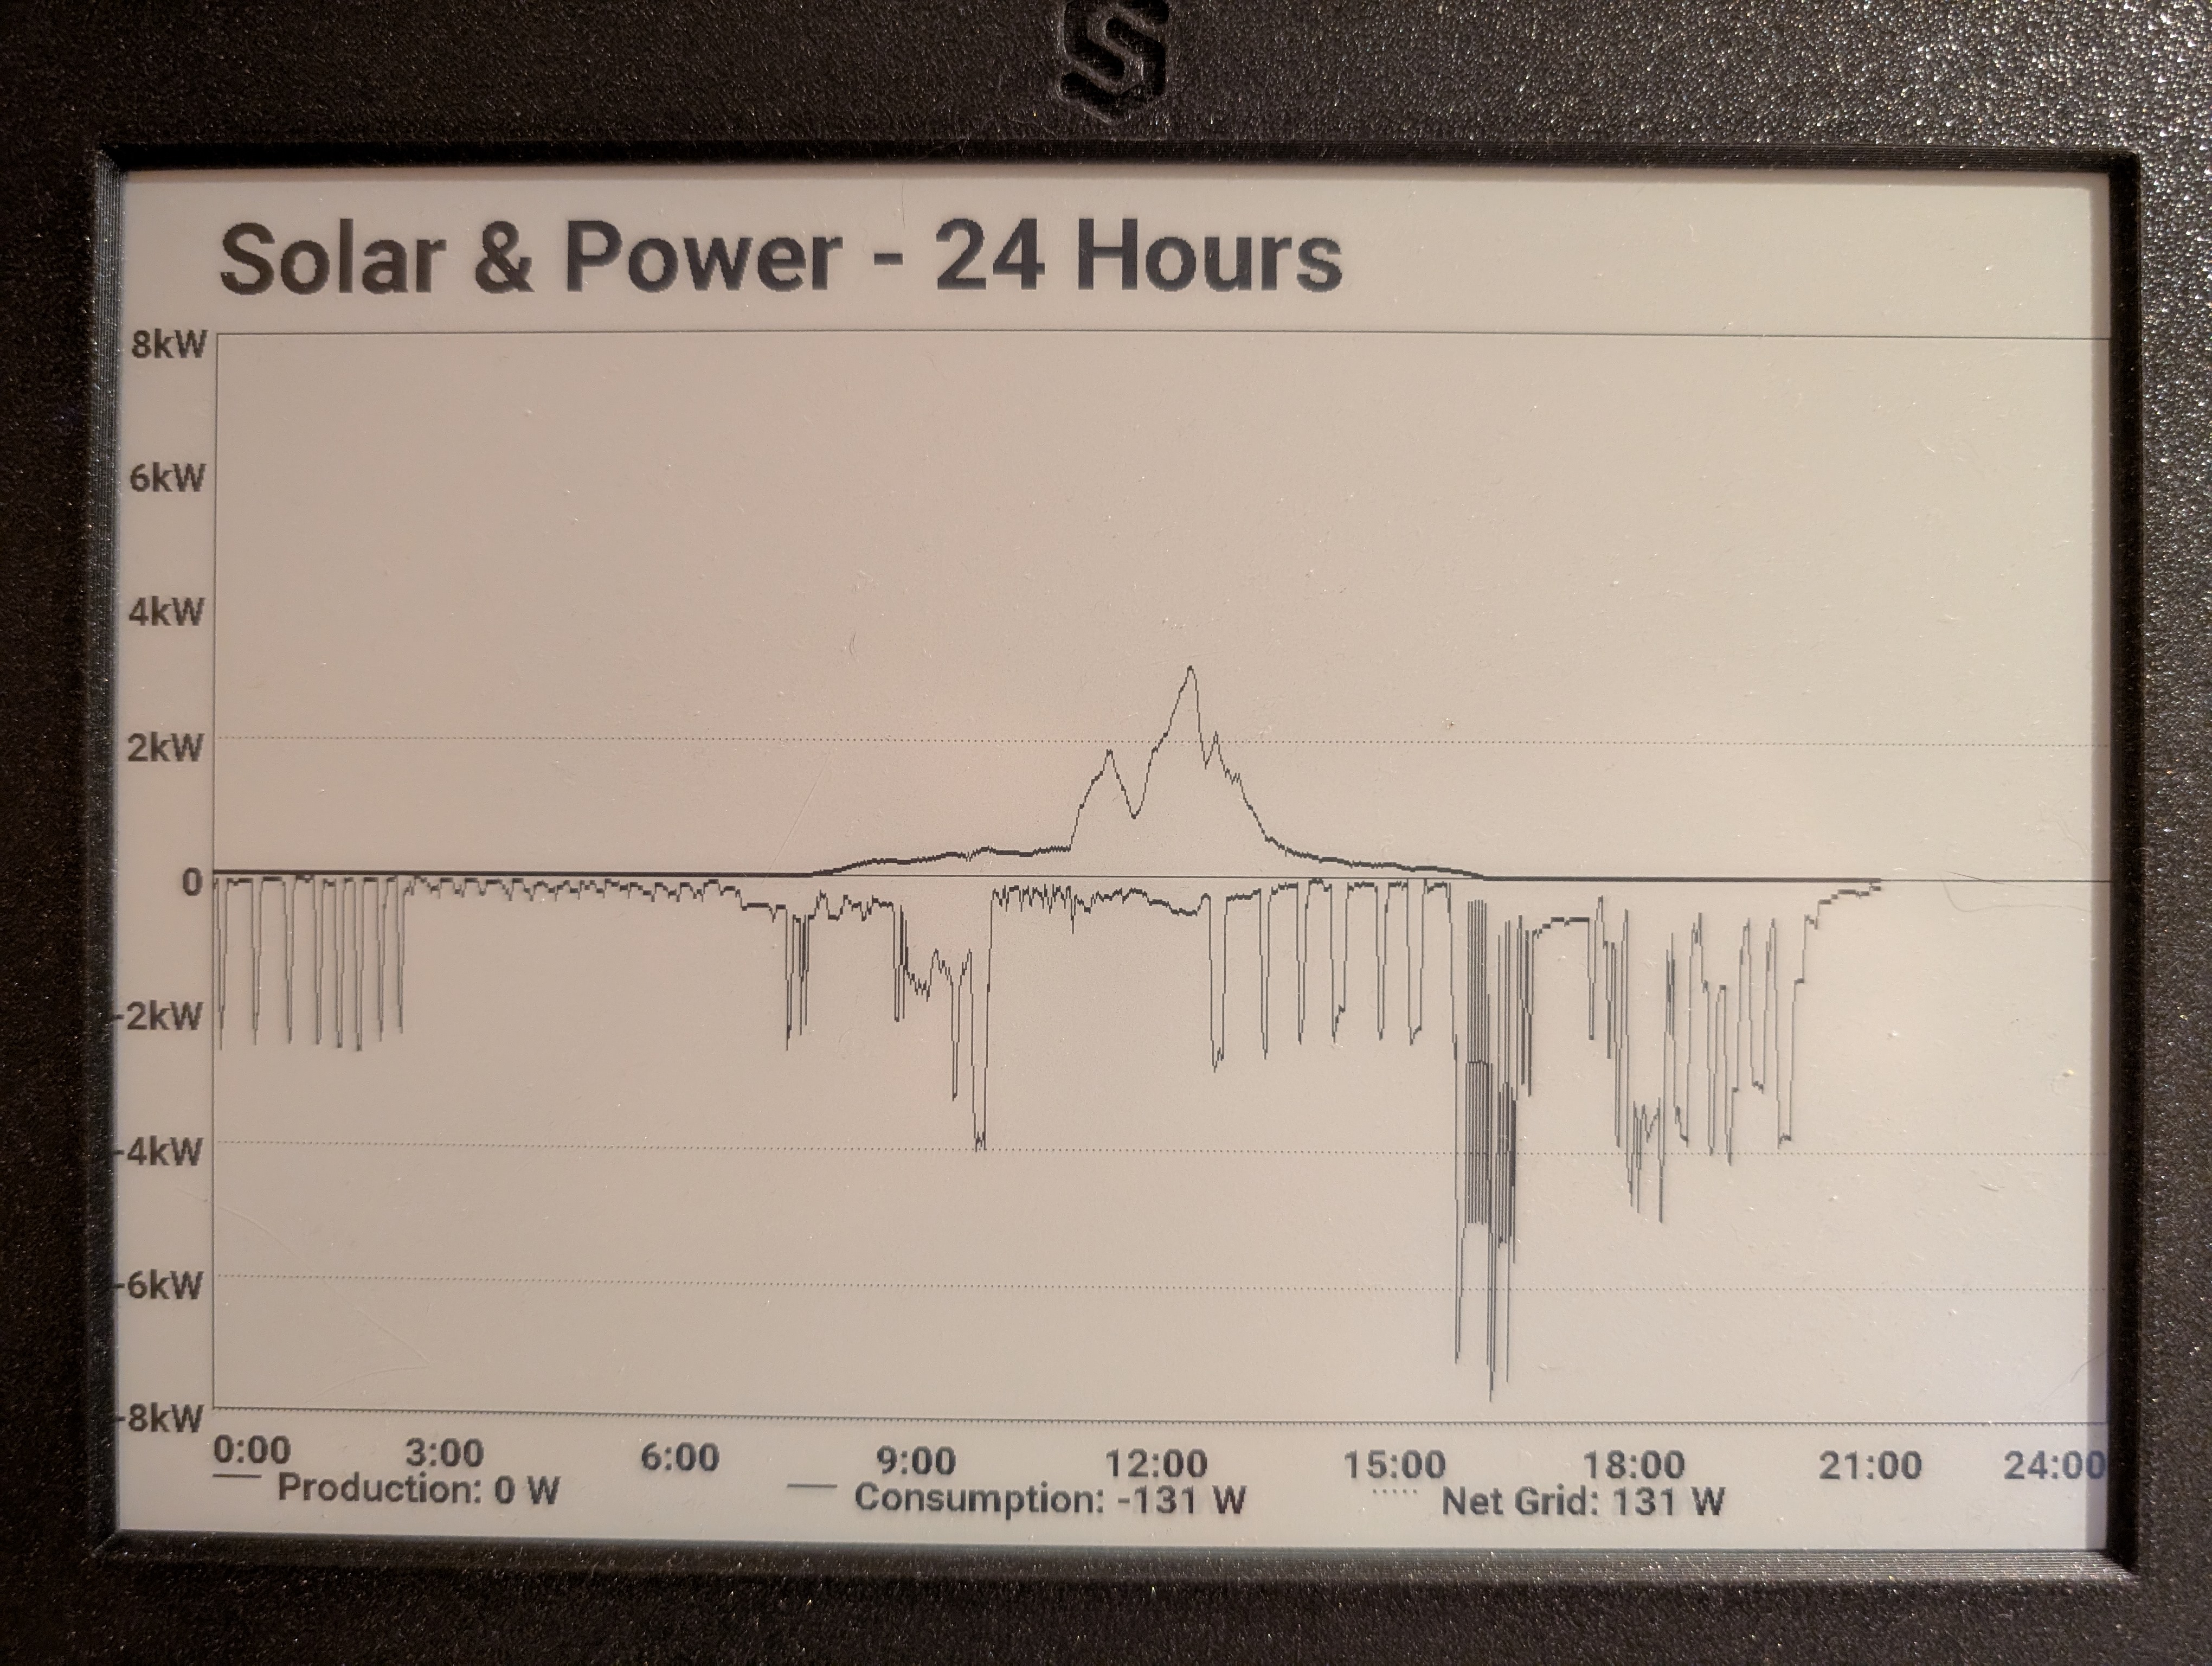
This is the same 10" upcycled Kindle display as before:
The positive Y axis represents production by the array, and the negative Y axis represents consumption. I previously had a line in the middle that represented Net, but it looked too busy. The X axis is time, midnight to midnight.
At midnight it reboots to clear the display and start a fresh day.
Architecture
Data
First we need to get the solar data. Luckily, this is data is readily provided by the manufacturer, Enphase.
You can even see these graphs on their App or web page:
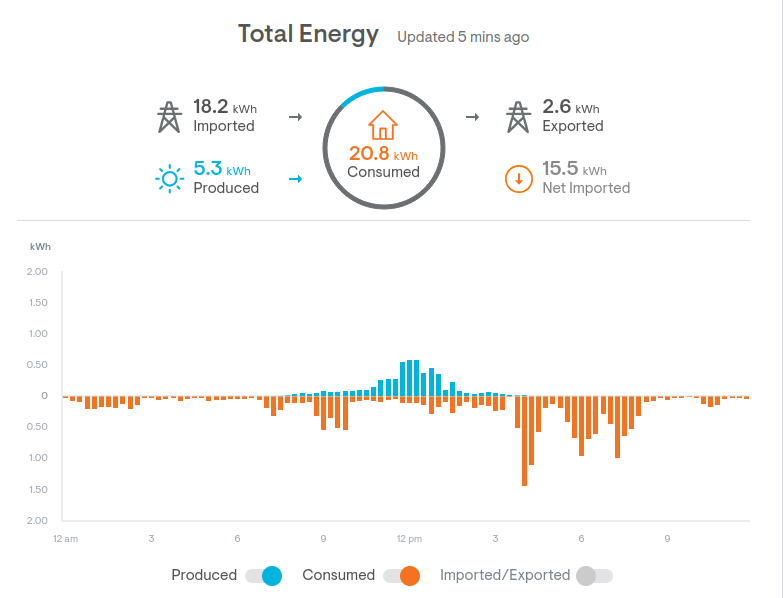
But I want my own graphs! And I don’t want to use the app.
Luckily they have a local API.
This is perfect. A small script that curls this JSON and puts the data onto MQTT is all I need.
There are lots of Enphase libraries and tools out there.
MQTT
Getting the data into MQTT simplifies a lot of integration code.
It means I only need 1 thing (the publisher) to be able to speak the Enphase API. Everything else, including the eInk display, can just talk MQTT (easy).
mosquitto_sub -h 10.0.2.1 -t 'envoy/meters/net-consumption/activePower'
2894.563
...
Display
I always like ESPHome for this stuff. Somebody else has written all the hard C++ code to talk to all this hardware.
I can put the pieces together, and connect the MQTT component to the Graph component to the eInk component. See the full config in the appendix1.
Not that it was easy!
The normal graph component was never designed like this. It is intended to be a sliding window over a certain FIFO of datapoints.
I really wanted a fixed X-axis. To do that I had to patch ESPHome to get a graph API where I could insert a specific datapoint at the exact current time we have.
Time Lapse
Because this display can do incremental updating, it can draw new datapoints slowly over time, without having to refresh the whole screen.
It kinda just fills in the day as time moves on. I think it is beautiful:
-
Here is the full config:
↩︎esp32: board: esp32dev framework: type: arduino cpu_frequency: 240MHz psram: i2c: time: - platform: sntp id: sntp_time timezone: America/Los_Angeles servers: - 10.0.2.1 on_time_sync: then: - logger.log: format: "Time synchronized! Current time: %d:%02d:%02d" args: ['id(sntp_time).now().hour', 'id(sntp_time).now().minute', 'id(sntp_time).now().second'] # Trigger sensor updates to populate graph now that we have valid time - component.update: solar_production_watts - component.update: grid_net_watts on_time: # Reboot at midnight to clear graph and start fresh for new day - seconds: 0 minutes: 0 hours: 0 then: - logger.log: "Midnight - rebooting to clear graph for new day" - lambda: |- ESP.restart(); mqtt: broker: !secret mqtt_broker log_topic: topic: dne level: NONE topic_prefix: null # Subscribe to solar MQTT topics text_sensor: - platform: mqtt_subscribe name: "Solar Production Power" id: solar_production_power topic: "envoy/meters/production/activePower" on_value: - component.update: solar_production_watts - component.update: total_consumption_watts - platform: mqtt_subscribe name: "Grid Net Power" id: grid_net_power topic: "envoy/meters/net-consumption/activePower" on_value: - component.update: grid_net_watts - component.update: total_consumption_watts # Global variables to store latest values globals: - id: latest_production type: float restore_value: no initial_value: 'NAN' - id: latest_grid_net type: float restore_value: no initial_value: 'NAN' - id: latest_consumption type: float restore_value: no initial_value: 'NAN' # Convert text values to numeric (in watts for graphing) sensor: - platform: template id: solar_production_watts name: "Solar Production Watts" update_interval: never lambda: |- if (id(solar_production_power).has_state()) { float val = atof(id(solar_production_power).state.c_str()); id(latest_production) = val; // Get current time and calculate graph index auto time = id(sntp_time).now(); ESP_LOGI("solar", "Time is valid: %s, hour=%d, min=%d, sec=%d", time.is_valid() ? "YES" : "NO", time.hour, time.minute, time.second); if (time.is_valid()) { int seconds_today = time.hour * 3600 + time.minute * 60 + time.second; int idx = (seconds_today * 1140) / 86400; // 1140px width, 86400 seconds/day ESP_LOGI("solar", "Calculated index %d for production value %.0f", idx, val); // Write to graph trace at time-based index auto trace = id(solar_combined_graph).get_trace(0); if (trace != nullptr) { trace->get_tracedata_mutable()->set_sample_at_index(idx, val); } } return val; } else { return std::nan(""); } - platform: template id: grid_net_watts name: "Grid Net Watts" update_interval: never lambda: |- if (id(grid_net_power).has_state()) { float mqtt_raw = atof(id(grid_net_power).state.c_str()); ESP_LOGI("solar", "MQTT Grid Net Raw: %.0f", mqtt_raw); float val = mqtt_raw; // Keep raw value for now id(latest_grid_net) = val; auto time = id(sntp_time).now(); if (time.is_valid()) { int seconds_today = time.hour * 3600 + time.minute * 60 + time.second; int idx = (seconds_today * 1140) / 86400; ESP_LOGI("solar", "Calculated index %d for grid_net value %.0f", idx, val); // Skip writing Grid Net to graph (makes it too busy) // auto trace = id(solar_combined_graph).get_trace(2); // if (trace != nullptr) { // trace->get_tracedata_mutable()->set_sample_at_index(idx, val); // } } return val; } else { return std::nan(""); } - platform: template id: total_consumption_watts name: "Total Consumption Watts" update_interval: never lambda: |- if (id(solar_production_watts).has_state() && id(grid_net_watts).has_state()) { float prod = id(solar_production_watts).state; float grid = id(grid_net_watts).state; ESP_LOGI("solar", "CALC: Production=%.0f, Grid=%.0f", prod, grid); float val = -(prod + grid); // Back to original formula ESP_LOGI("solar", "CALC: Consumption = -(%.0f + %.0f) = %.0f", prod, grid, val); id(latest_consumption) = val; auto time = id(sntp_time).now(); if (time.is_valid()) { int seconds_today = time.hour * 3600 + time.minute * 60 + time.second; int idx = (seconds_today * 1140) / 86400; ESP_LOGI("solar", "Calculated index %d for consumption value %.0f", idx, val); auto trace = id(solar_combined_graph).get_trace(1); if (trace != nullptr) { trace->get_tracedata_mutable()->set_sample_at_index(idx, val); // Recalculate min/max for all traces id(solar_combined_graph).get_trace(0)->get_tracedata_mutable()->recalc_minmax(); id(solar_combined_graph).get_trace(1)->get_tracedata_mutable()->recalc_minmax(); id(solar_combined_graph).get_trace(2)->get_tracedata_mutable()->recalc_minmax(); } // Trigger display update after all values updated id(inkplate_display).update(); } return val; } else { return std::nan(""); } # Define unified graph with all three traces (no sensor - manually managed) graph: - id: solar_combined_graph duration: 24h width: 1140 height: 650 min_value: -8000 max_value: 8000 y_grid: 2000 traces: - name: "Solar Production" continuous: true line_type: SOLID color: black - name: "Total Consumption" continuous: true line_type: SOLID color: black - name: "Grid Net" continuous: true line_type: DOTTED color: black color: - id: black red: 0% green: 0% blue: 0% pca6416a: - id: pca6416a_hub address: 0x20 display: - platform: inkplate id: inkplate_display greyscale: false partial_updating: true update_interval: 60s full_update_every: 60 model: inkplate_10 rotation: 180 ckv_pin: 32 sph_pin: 33 gmod_pin: pca6416a: pca6416a_hub number: 1 gpio0_enable_pin: pca6416a: pca6416a_hub number: 8 oe_pin: pca6416a: pca6416a_hub number: 0 spv_pin: pca6416a: pca6416a_hub number: 2 powerup_pin: pca6416a: pca6416a_hub number: 4 wakeup_pin: pca6416a: pca6416a_hub number: 3 vcom_pin: pca6416a: pca6416a_hub number: 5 # Data pins for parallel GPIO (defaults) display_data_0_pin: 4 display_data_1_pin: 5 display_data_2_pin: 18 display_data_3_pin: 19 display_data_4_pin: 23 display_data_5_pin: 25 display_data_6_pin: 26 display_data_7_pin: 27 lambda: |- // Fill background with white it.fill(COLOR_ON); // Title it.print(60, 20, id(font_xlarge), COLOR_OFF, "Solar & Power - 24 Hours"); // Draw the combined graph (with margin for Y-axis labels) int graph_x = 60; int graph_y = 100; int graph_width = 1140; int graph_height = 650; // Draw manual dotted gridlines BEFORE graph (so graph lines appear on top) // Each 2000W = 81.25px (650px height / 16000W range * 2000W) // Draw dotted horizontal lines at 8kW, 6kW, 4kW, 2kW, 0, -2kW, -4kW, -6kW, -8kW int gridline_y[] = { graph_y, // 8kW (top) graph_y + 81, // 6kW graph_y + 162, // 4kW graph_y + 244, // 2kW graph_y + 325, // 0kW (middle) graph_y + 406, // -2kW graph_y + 488, // -4kW graph_y + 569, // -6kW graph_y + 650 // -8kW (bottom) }; for (int i = 0; i < 9; i++) { // Draw dotted line: pixel every 4 pixels for (int x = graph_x; x < graph_x + graph_width; x += 4) { it.draw_pixel_at(x, gridline_y[i], COLOR_OFF); } } it.graph(graph_x, graph_y, id(solar_combined_graph)); // Draw box around graph it.rectangle(graph_x, graph_y, graph_width, graph_height, COLOR_OFF); // Draw solid horizontal line at y=0 (middle of the graph) // Graph range is -8000 to 8000, so 0 is at middle height int zero_y = graph_y + graph_height / 2; it.line(graph_x, zero_y, graph_x + graph_width, zero_y, COLOR_OFF); // Left Y-axis labels (every 2kW, matching y_grid) // Each 2000W = 81.25px (650px height / 16000W range * 2000W) it.printf(graph_x - 5, graph_y - 8, id(font_small), COLOR_OFF, TextAlign::TOP_RIGHT, "8kW"); it.printf(graph_x - 5, graph_y + 81 - 8, id(font_small), COLOR_OFF, TextAlign::TOP_RIGHT, "6kW"); it.printf(graph_x - 5, graph_y + 162 - 8, id(font_small), COLOR_OFF, TextAlign::TOP_RIGHT, "4kW"); it.printf(graph_x - 5, graph_y + 244 - 8, id(font_small), COLOR_OFF, TextAlign::TOP_RIGHT, "2kW"); it.printf(graph_x - 5, graph_y + 325 - 8, id(font_small), COLOR_OFF, TextAlign::TOP_RIGHT, "0"); it.printf(graph_x - 5, graph_y + 406 - 8, id(font_small), COLOR_OFF, TextAlign::TOP_RIGHT, "-2kW"); it.printf(graph_x - 5, graph_y + 488 - 8, id(font_small), COLOR_OFF, TextAlign::TOP_RIGHT, "-4kW"); it.printf(graph_x - 5, graph_y + 569 - 8, id(font_small), COLOR_OFF, TextAlign::TOP_RIGHT, "-6kW"); it.printf(graph_x - 5, graph_y + 650 - 8, id(font_small), COLOR_OFF, TextAlign::TOP_RIGHT, "-8kW"); // X-axis labels (every 3 hours from midnight to midnight) // Graph width: 1140px / 24 hours = 47.5px per hour int x_label_y = 760; it.printf(graph_x, x_label_y, id(font_small), COLOR_OFF, TextAlign::TOP_LEFT, "0:00"); it.printf(graph_x + 142, x_label_y, id(font_small), COLOR_OFF, TextAlign::TOP_CENTER, "3:00"); it.printf(graph_x + 285, x_label_y, id(font_small), COLOR_OFF, TextAlign::TOP_CENTER, "6:00"); it.printf(graph_x + 427, x_label_y, id(font_small), COLOR_OFF, TextAlign::TOP_CENTER, "9:00"); it.printf(graph_x + 570, x_label_y, id(font_small), COLOR_OFF, TextAlign::TOP_CENTER, "12:00"); it.printf(graph_x + 712, x_label_y, id(font_small), COLOR_OFF, TextAlign::TOP_CENTER, "15:00"); it.printf(graph_x + 855, x_label_y, id(font_small), COLOR_OFF, TextAlign::TOP_CENTER, "18:00"); it.printf(graph_x + 997, x_label_y, id(font_small), COLOR_OFF, TextAlign::TOP_CENTER, "21:00"); it.printf(graph_x + graph_width, x_label_y, id(font_small), COLOR_OFF, TextAlign::TOP_RIGHT, "24:00"); // Legend at bottom - HORIZONTAL layout below graph int legend_y = 790; // Production (solid line) - left section it.filled_rectangle(graph_x, legend_y, 30, 2, COLOR_OFF); it.printf(graph_x + 40, legend_y - 8, id(font_small), COLOR_OFF, "Production: %.0f W", id(latest_production)); // Consumption (solid line) - middle section int consumption_x = graph_x + 350; it.filled_rectangle(consumption_x, legend_y, 30, 2, COLOR_OFF); it.printf(consumption_x + 40, legend_y - 8, id(font_small), COLOR_OFF, "Consumption: %.0f W", id(latest_consumption)); // Net Grid (dotted line - 5 dots) - right section int grid_x = graph_x + 700; it.filled_rectangle(grid_x, legend_y, 2, 2, COLOR_OFF); it.filled_rectangle(grid_x + 6, legend_y, 2, 2, COLOR_OFF); it.filled_rectangle(grid_x + 12, legend_y, 2, 2, COLOR_OFF); it.filled_rectangle(grid_x + 18, legend_y, 2, 2, COLOR_OFF); it.filled_rectangle(grid_x + 24, legend_y, 2, 2, COLOR_OFF); it.printf(grid_x + 40, legend_y - 8, id(font_small), COLOR_OFF, "Net Grid: %.0f W", id(latest_grid_net)); font: - file: "fonts/Roboto-Bold.ttf" id: font_small size: 24 - file: "fonts/Roboto-Bold.ttf" id: font_xlarge size: 60